Plot2d
Plot2d takes 3 1-dim arrays (x, y and z), where each index is one point.
[1]:
from smpl import plot
import numpy as np
import smpl
print(smpl.__version__)
1.3.0.303
[2]:
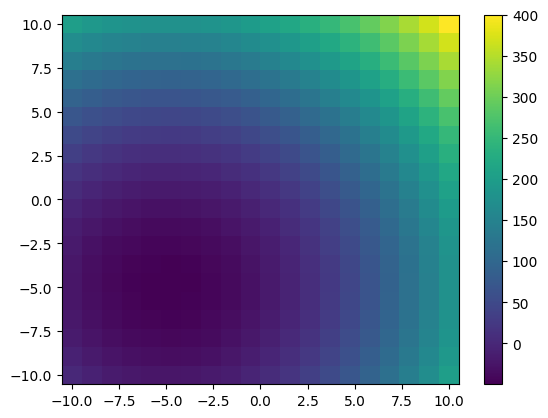
xvalues = np.linspace(-10,10,20)
yvalues = np.linspace(-10,10,20)
xx, yy = np.meshgrid(xvalues, yvalues)
xx = xx.reshape(xx.size)
yy = yy.reshape(yy.size)
plot.plot2d(xx,yy,xx**2+yy**2+10*xx+10*yy,fill_missing=False,interpolation="bilinear",logz=False)
[3]:
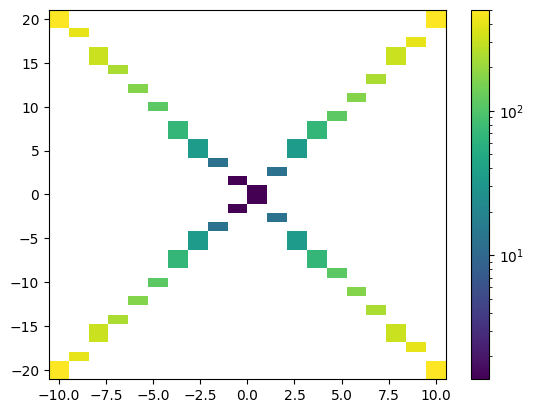
xvalues = np.linspace(-10,10,20)
yvalues = xvalues*2
xx = xvalues
yy = yvalues
xx = np.append(xx,xx)
yy = np.append(yy,-yy)
zz = xx**2+yy**2
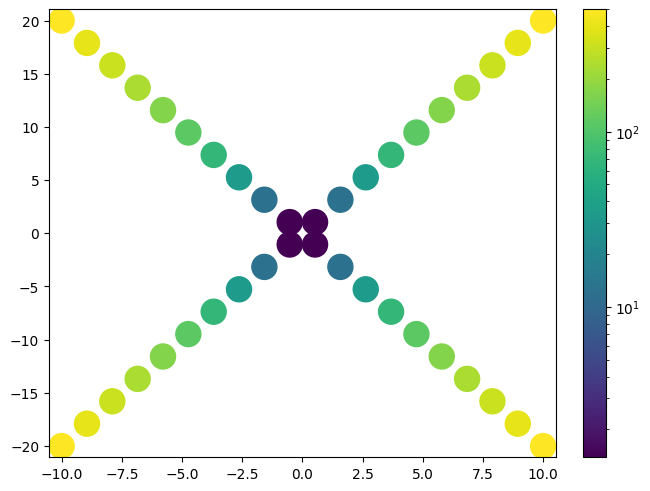
plot.plot2d(xx,yy,xx**2+yy**2,fill_missing=True)
plot.plot2d(xx,yy,xx**2+yy**2,style='scatter',fill_missing=True)
[4]:
plot.close()
[ ]:
[ ]:
[ ]: