[1]:
import numpy as np
import smpl
from smpl import plot
print(smpl.__version__)
1.3.0.303
[2]:
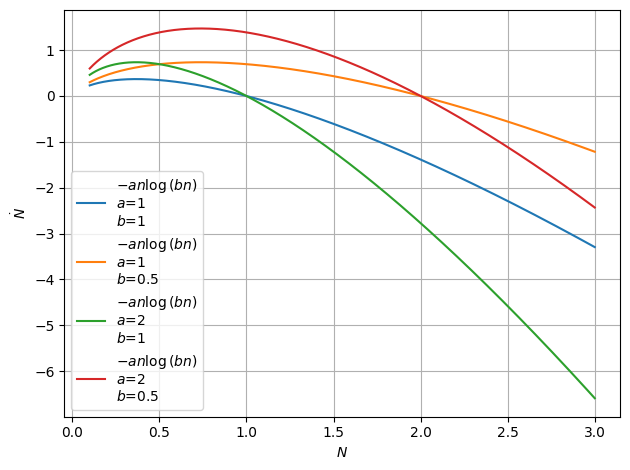
def gompertz(n,a,b):
return -a * n * np.log(b*n)
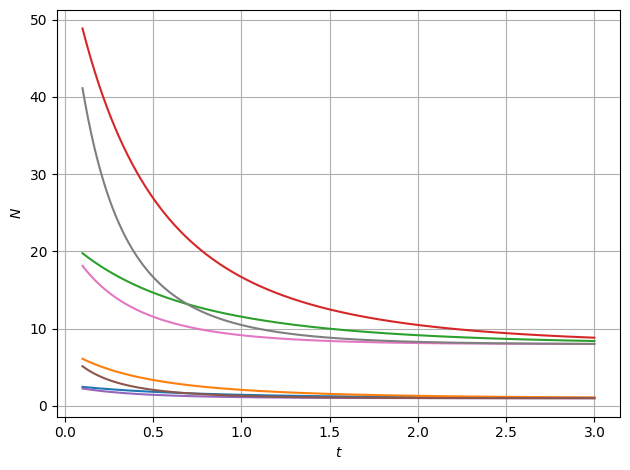
def solution_gompertz(t,a,b,c):
return 1/b*np.exp(np.exp(-t*a)*c)
Multi Plot
Different color
Separation of Variables:
\[\int \frac{1}{N \ln (bN)} dN = \ln(\ln(bN)) +c= -adt =-at\]
\[\implies N(t) = \frac{1}{b} \exp (c \exp (-t a))\]
[3]:
for a in [1,2]:
    for b in [1,0.5]:
        plot.function( gompertz, a,b, xaxis="$N$", yaxis="$\\dot N$",xmin=0.1, xmax=3 ,init=False )
[4]:
for a in [1,2]:
    for b in [1,1/8]:
        for c in [1,2]:
            plot.function( solution_gompertz, a,b,c, xaxis="$t$", yaxis="$N$",xmin=0.1, xmax=3,init=False,lpos=-1)
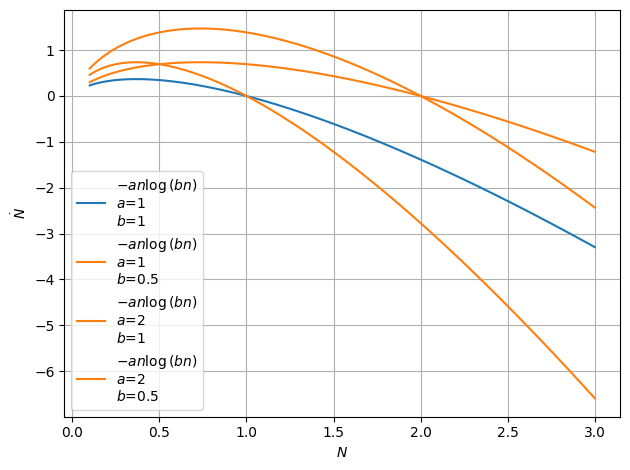
Same color
[5]:
for a in [1,2]:
    for b in [1,0.5]:
        plot.function( gompertz, a,b, xaxis="$N$", yaxis="$\\dot N$",xmin=0.1, xmax=3 ,init=False,next_color=a == b )
[ ]:
[ ]: