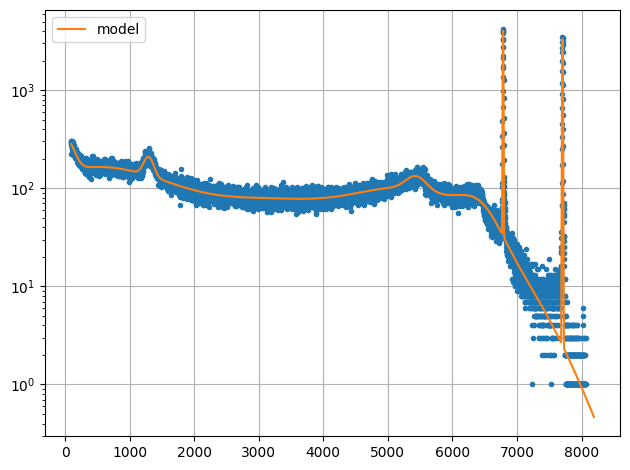
Residue Plot
[1]:
from smpl import plot
from smpl import io
from smpl import functions as f
import numpy as np
import uncertainties.unumpy as unp
import matplotlib.pyplot as plt
import smpl
smpl.__version__
[1]:
'1.3.0'
[2]:
dat = np.loadtxt(io.find_file("dat.dat",3), skiprows=0, delimiter=" ")


xdata = dat[:,0]
ydata = dat[:,1]
ymodel = dat[:,-2]
[3]:
plot.data(xdata,ydata,logy=True,ss=False)
plot.data(xdata,ymodel,fmt="-",logy=True,init=False,label="model")
[ ]:
[4]:
data = np.loadtxt(io.find_file('test_linear_data.txt',3))
xdata = data[:,0]
xerr = data[:,2]
ydata = data[:,1]
yerr = data[:,3]
x = unp.uarray(xdata,xerr)
y = unp.uarray(ydata,yerr)
[5]:
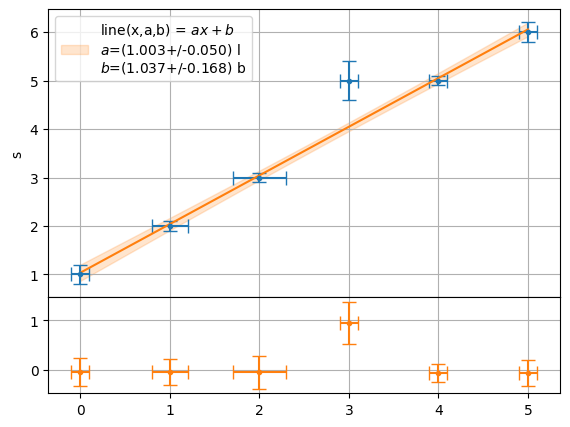
plot.fit(x,y,function=f.line,residue=True,xaxis="t",yaxis="s",units=["l","b"],sigmas=1)
/__w/smpl/smpl/smpl/plot.py:852: UserWarning: This figure includes Axes that are not compatible with tight_layout, so results might be incorrect.
  plt.tight_layout()
/__w/smpl/smpl/smpl/plot.py:852: UserWarning: The figure layout has changed to tight
  plt.tight_layout()
[5]:
[1.0034626572607985+/-0.05025400946361086,
 1.0370200979931061+/-0.16762115152506676]
[6]:
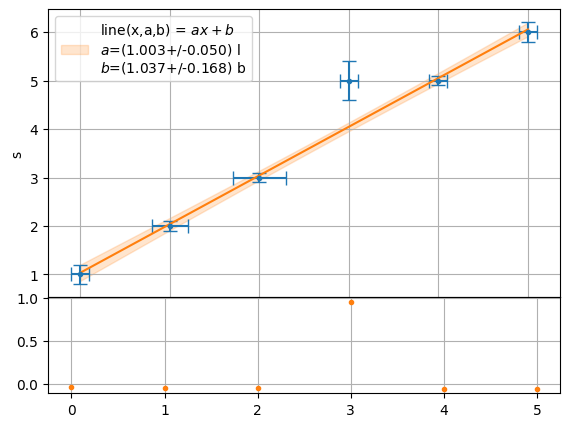
plot.fit(x,y,function=f.line,residue=True,xaxis="t",yaxis="s",units=["l","b"],sigmas=1,residue_err=False)
[6]:
[1.0034626572607985+/-0.05025400946361086,
 1.0370200979931061+/-0.16762115152506676]
[ ]: