Examples:
Modules:
line()
Profiling:
Links:
Versions:
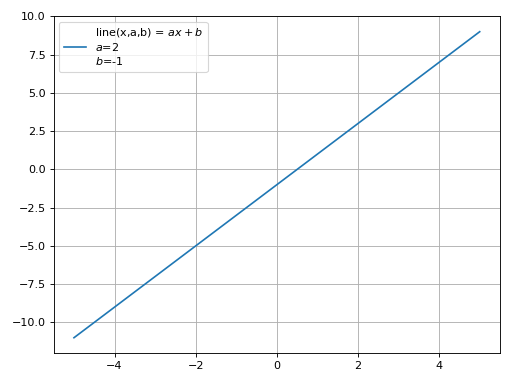
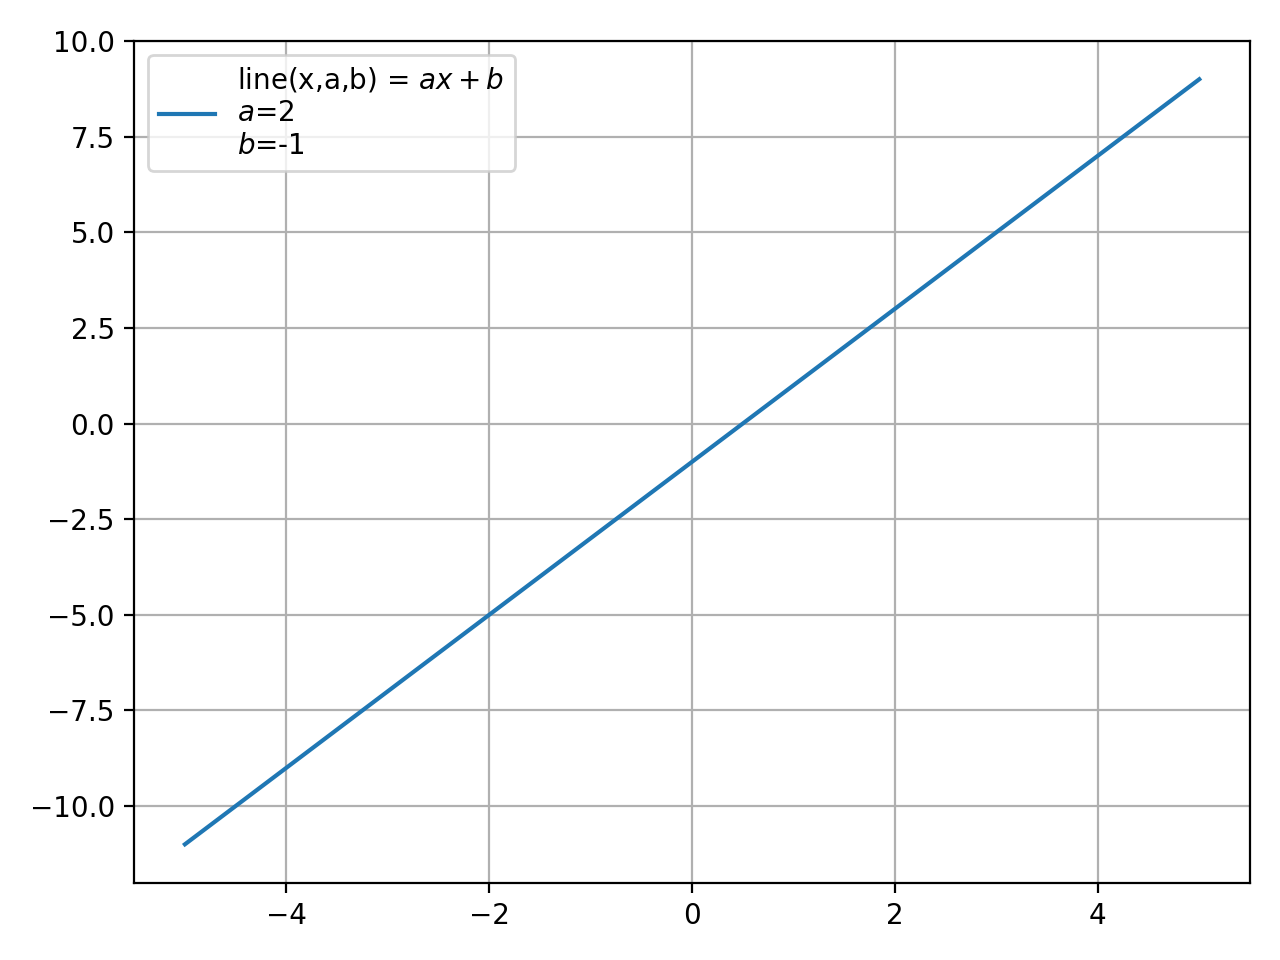
line(x,a,b) = \(a x + b\)
>>> from smpl.functions import line
>>> from smpl import plot
>>> plot.function(line,2,-1,xmin=-5,xmax=5)
(Source code, png, hires.png, pdf)
Source code
png
hires.png
pdf
