Examples:
Modules:
log()
Profiling:
Links:
Versions:
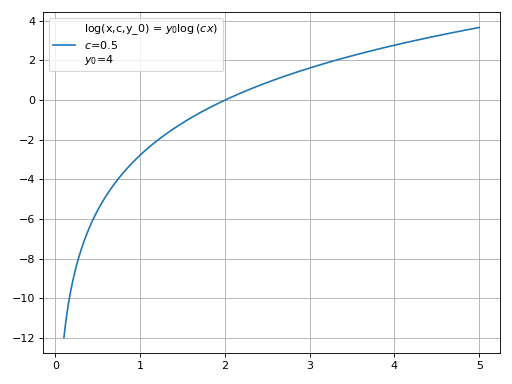
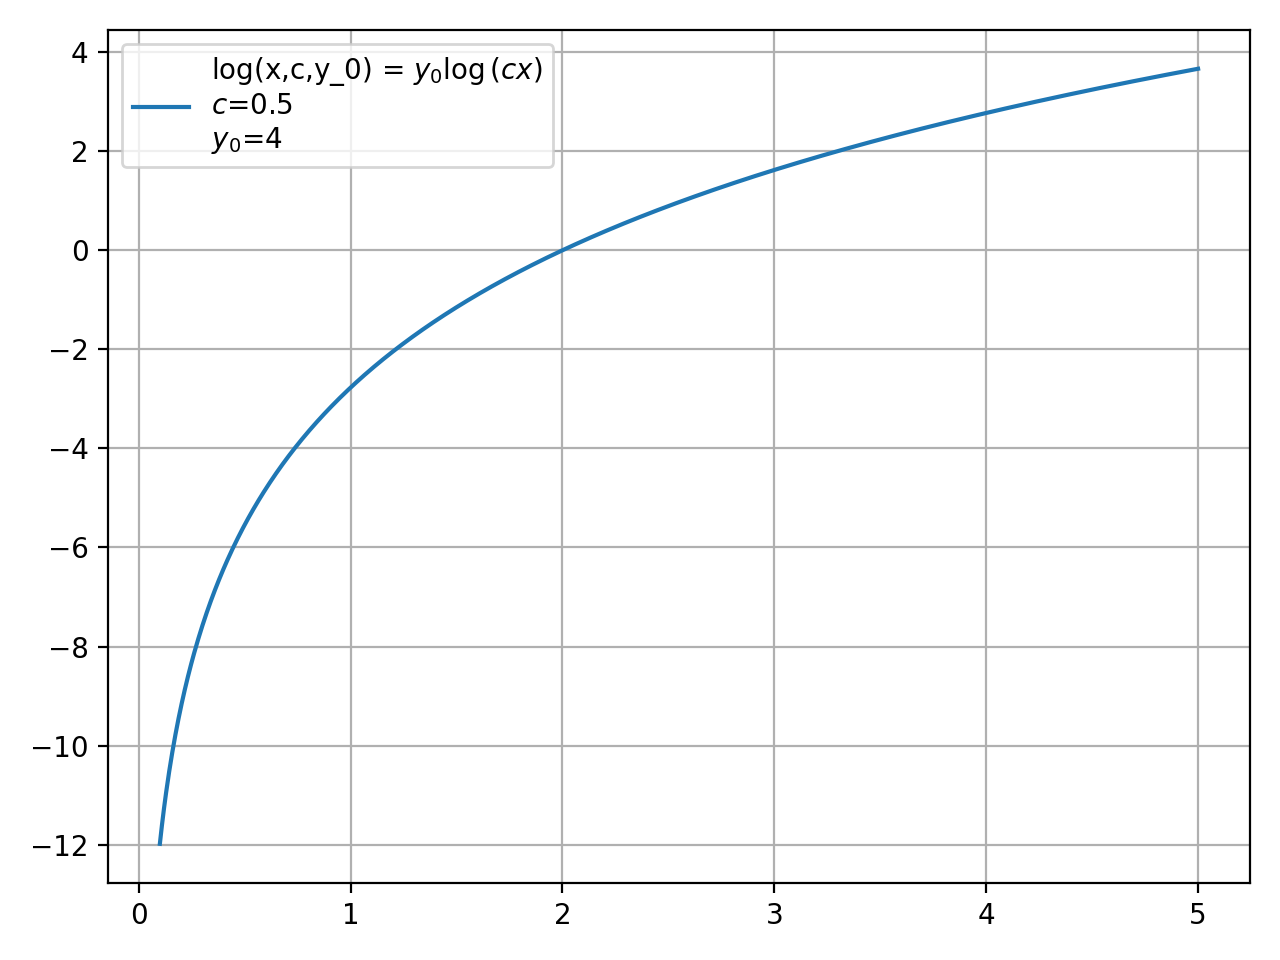
log(x,c,y_0) = \(y_{0} \log{\left(c x \right)}\)
>>> from smpl.functions import log
>>> from smpl import plot
>>> plot.function(log,0.5,4,xmin=0.1,xmax=5)
(Source code, png, hires.png, pdf)
Source code
png
hires.png
pdf
